In this study only the ancient latitude, calculated from site data, is plotted. This latitude data represents the ancient location of each sample site relative to the ancient poles and equator. In conventional studies site latitude is rarely recorded, the primary focus being to establish the position of the ancient pole for use in apparent-polar-wander studies. The fundamentals of palaeomagnetics, plus establishing ancient poles and equators on Expansion Tectonic models is comprehensively covered in each of my publications: http://www.expansiontectonics.com/page46.html
The site data plotted here on each of the Expansion Tectonic geographical small Earth models is colour coded to coincide with each of the present-day climate zones. Dark blue dots represent data located within the north and south Polar Regions (± 66.5 degrees north and south), the green dots represent data located within the north and south Temperate Zones (± 23.5 degrees to ± 66.5 degrees north and south), and the red dots represent data located within the equatorial Tropical Zones (+23.5 degrees to -23.5 degrees north and south).
On each small Earth model the various climate zone circles are shown by the yellow dashed lines. In addition, fine dashed yellow lines are also shown north and south of the main circles to represent a plus/minus 5 degrees error assigned to each calculated ancient site latitude.
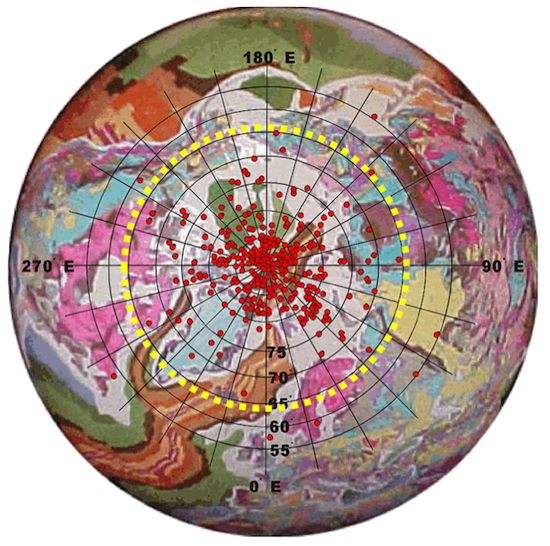
This 5 degrees of error is an average of the errors assigned to each data point within the NGDB database and is considered conservative. The true degree of uncertainty in palaeomagnetic data can be seen in the distribution of north poles plotted on the present-day model of the Earth shown below. In this figure the distribution of North Pole data points, shown as red dots, has an actual scatter of around 25 degrees of latitude. These pole locations are present-day poles, where the degree of structural correction or magnetic screening of the site sample data is minimal, as compared to older time periods where correction is at a maximum. Site latitude calculated from this same pole data will also show a ± 25 degree error which will be reflected in colour-coded data points seemingly located outside their actual climate zones.